
TnG Machine Monitoring System
See every machine. Measure every part. Live production, quality and downtime visibility, captured straight from the CNC control, not from paperwork.
What a plant cannot see today
Production counted by hand
Operator log sheets and the machine counter rarely agree. Nobody knows which number is right, and by the time anyone checks, the shift is gone.
Downtime with no reason
The machine stopped for 40 minutes. Was it a tool change, a breakdown, or no material? Without a reason captured at the moment, it cannot be improved.
OEE calculated in Excel
Assembled days later from partial data. Useful for a report, useless for a decision on the floor.
Quality found too late
Rejections surface at final inspection, long after the machine has produced another hundred parts the same way.
How the system works
Machine connectivity
Machine status, production counts and cycle timing are read from the CNC control automatically, every 100 milliseconds.
Production records
Each record is linked to the active part, operator and shift, with downtime reasons and inspection results.
Team access
Desktop, web and mobile views all show the same stored production record.
Reports and alerts
Dashboards, scheduled Excel/PDF reports and alerts routed to the responsible team.
Everything the shift needs, live
Plant overview
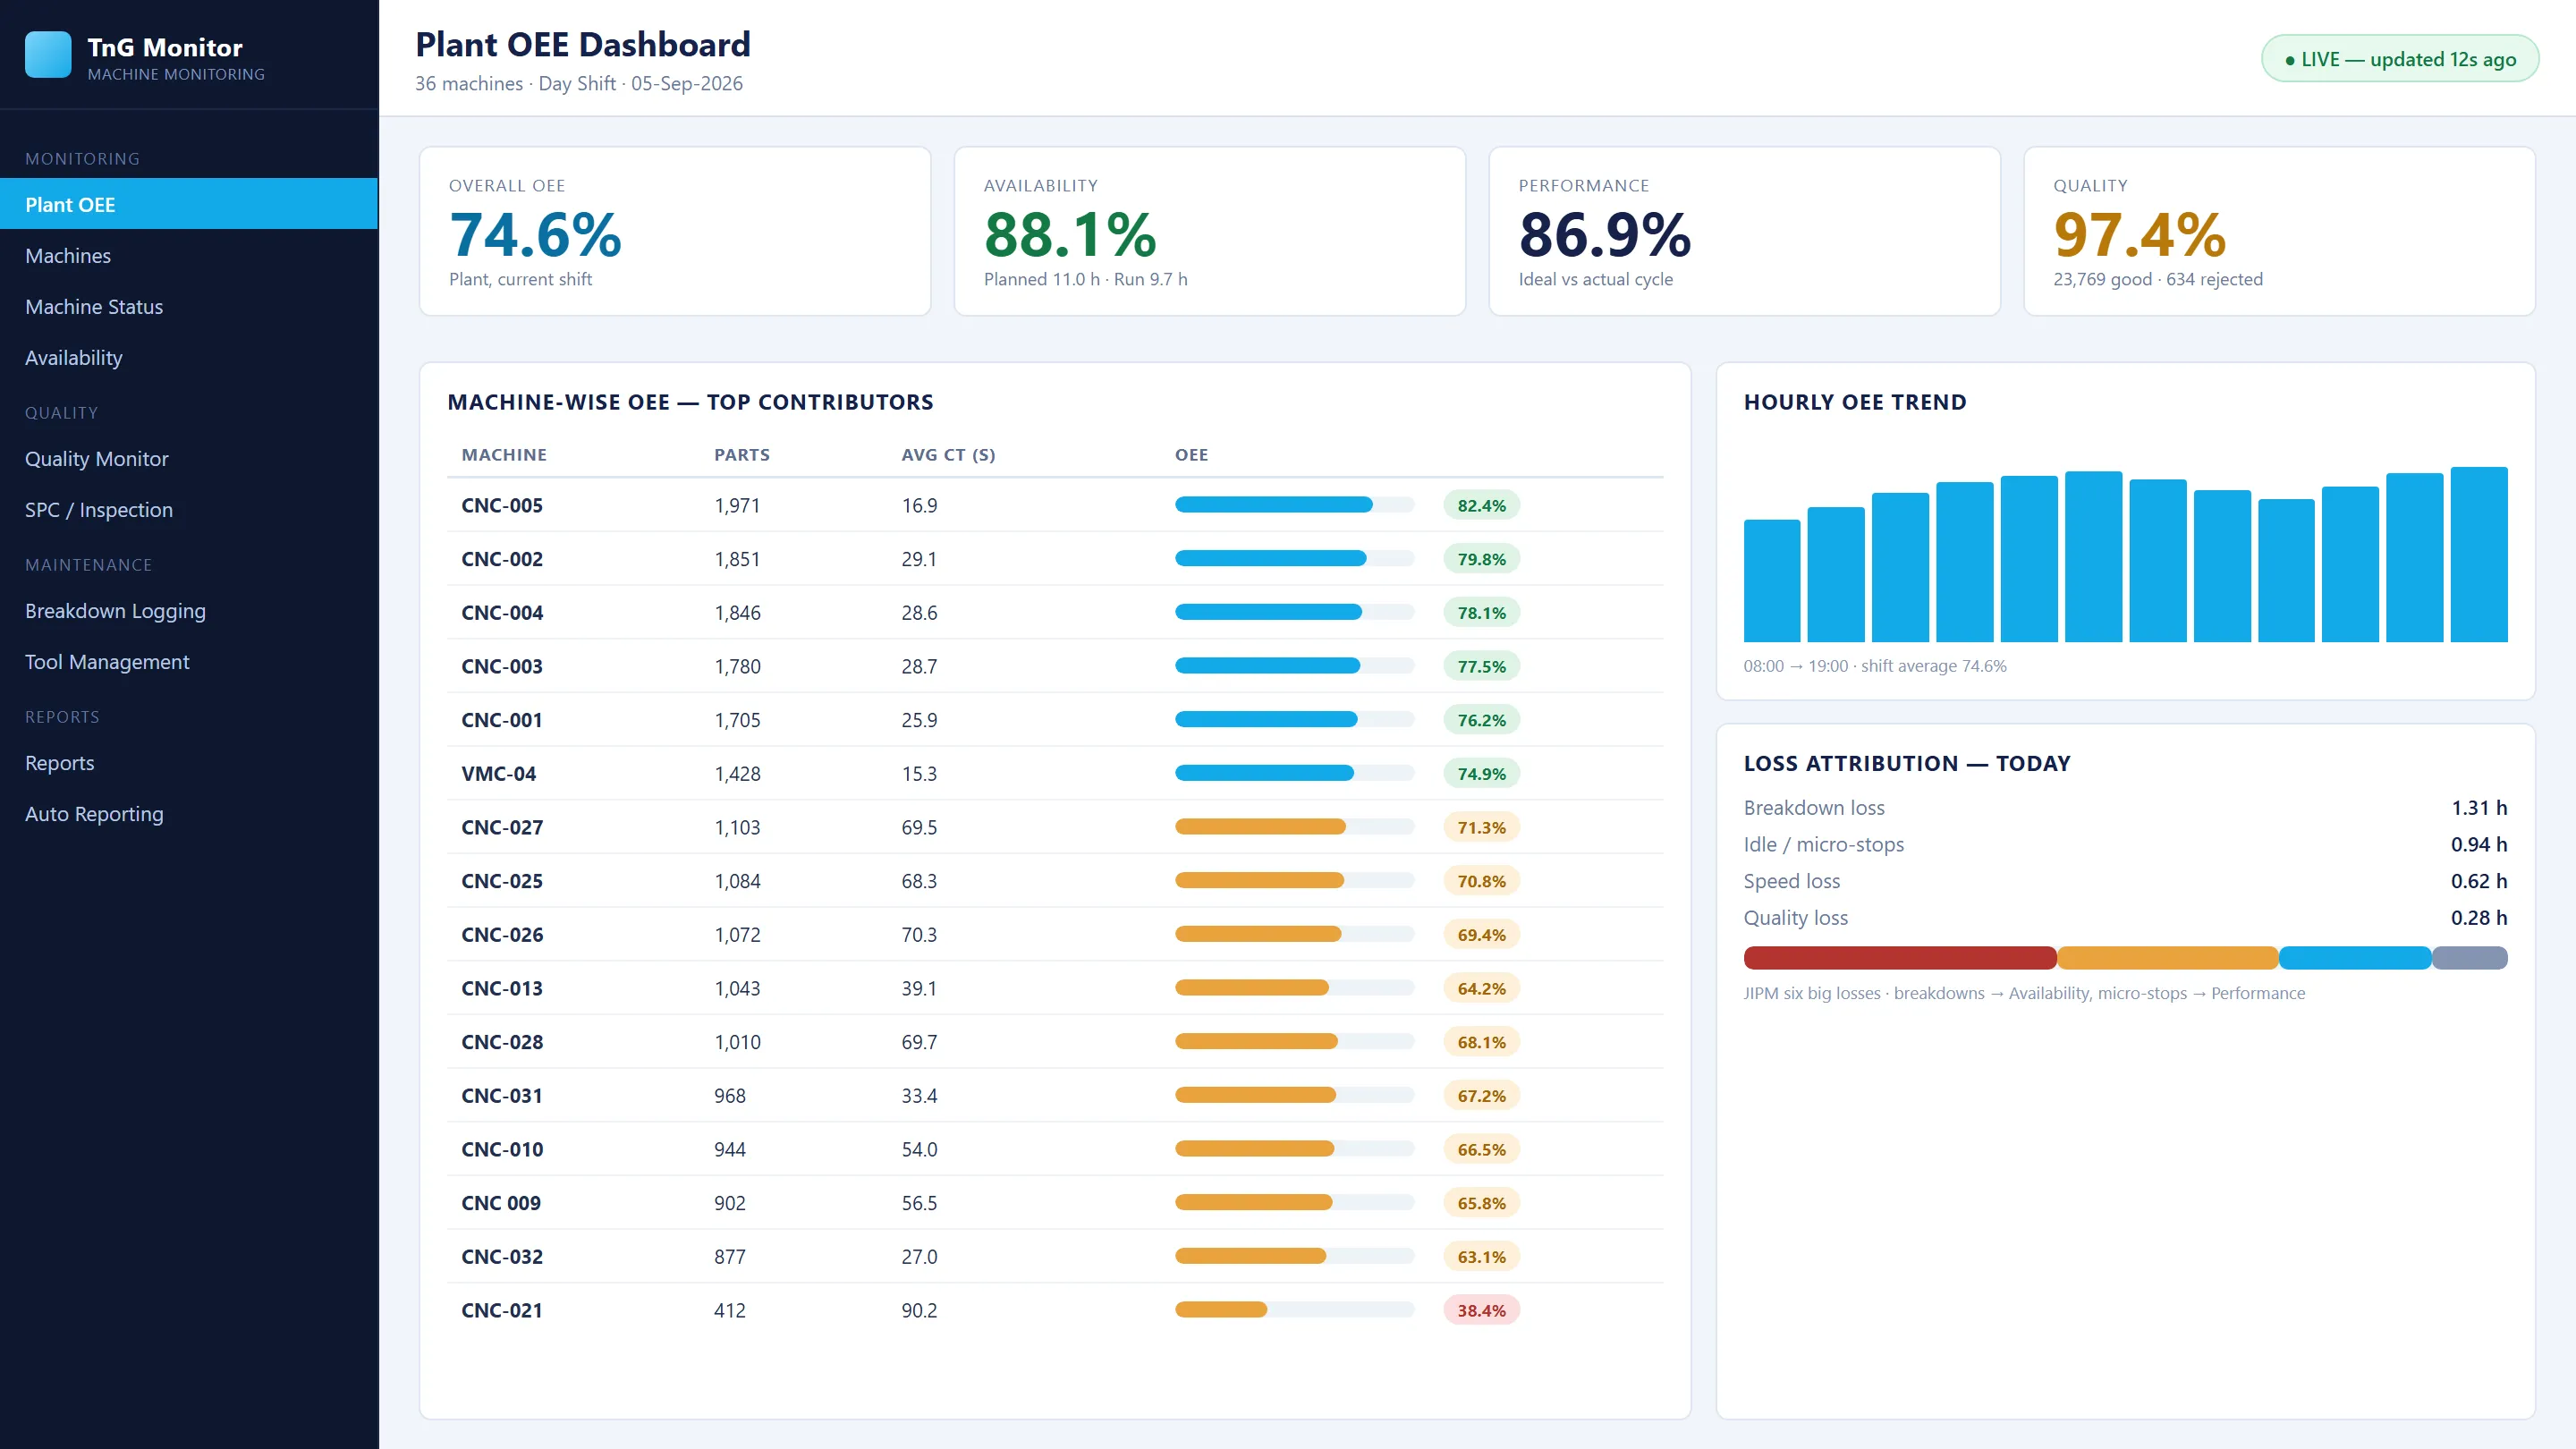
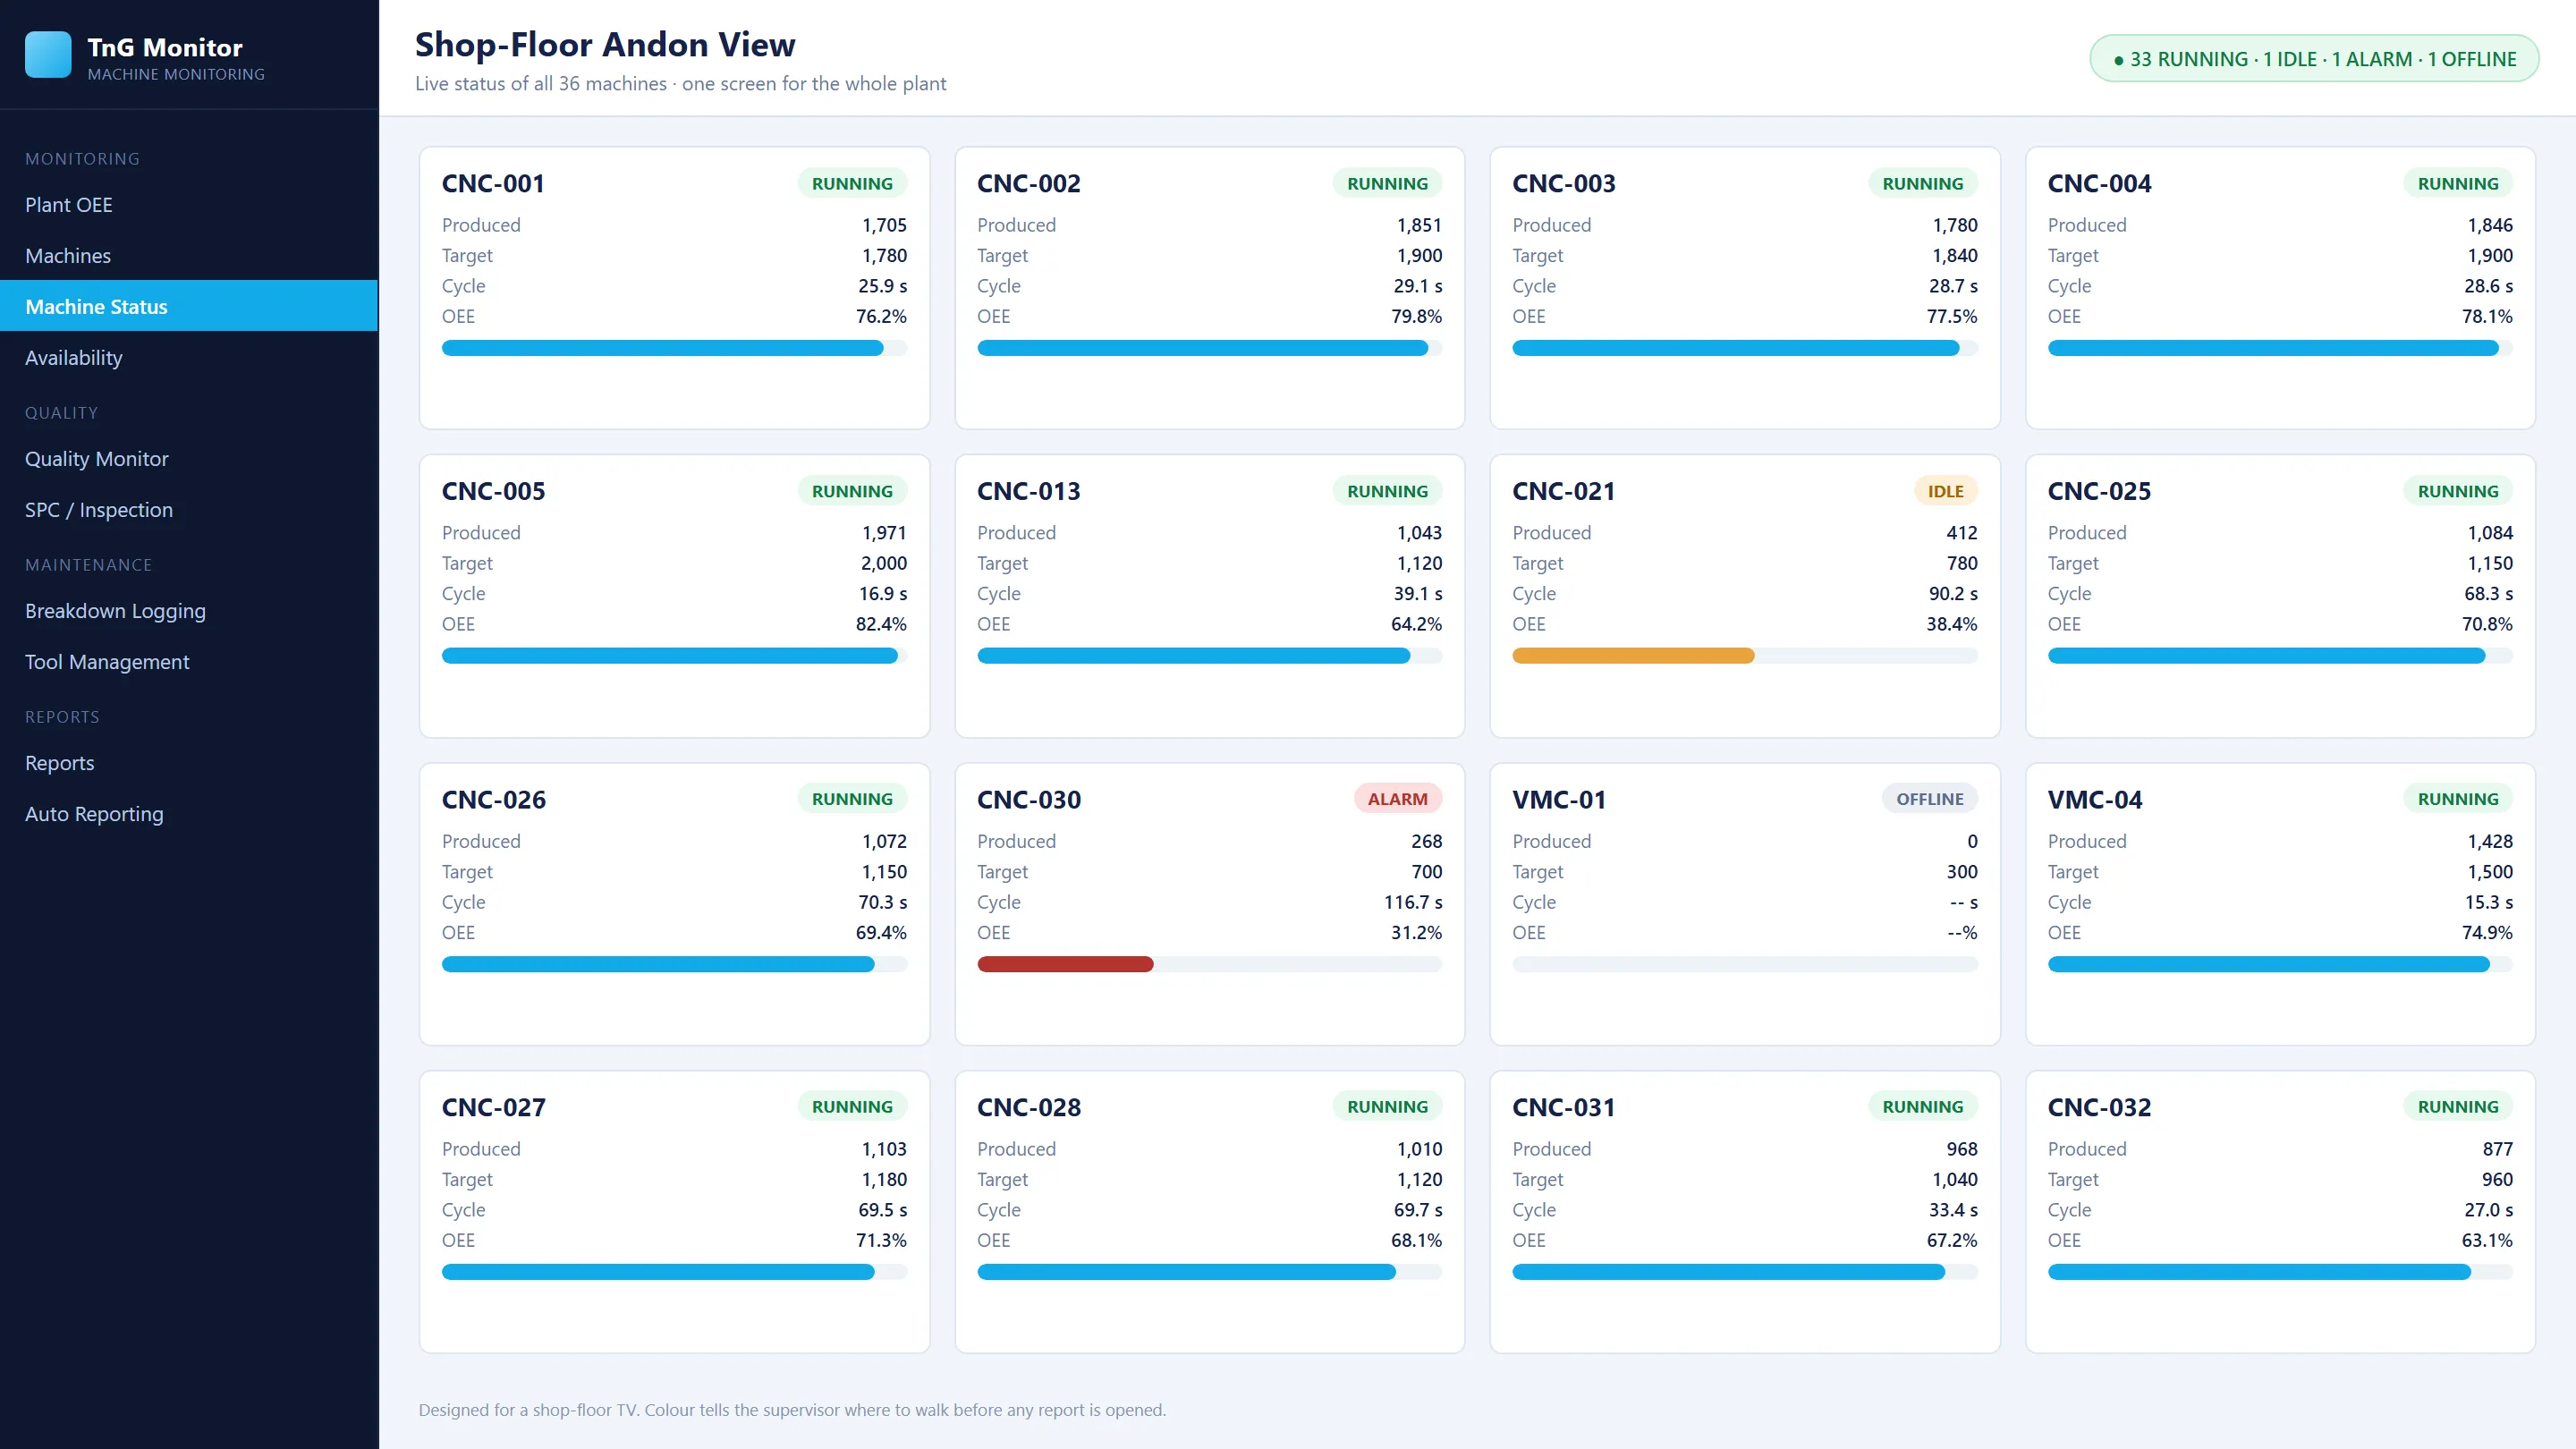
Plant-level OEE, availability and productivity for the selected shift, with every machine's running, idle, alarm or offline state on one screen.
Machine-level intelligence
Active part and operator, current versus average cycle time against the approved target, and SCADA pieces versus the CNC part counter.
Live OEE
OEE = Availability × Performance × Quality, calculated continuously from recorded running time, output and rejections under your agreed shift settings.
Automatic breakdown records
Configured thresholds open a stop record automatically. The operator records the category, the technician the detailed cause.
Alerts to the right person
Each breakdown category routes to a department or named contacts by email, Telegram or mobile alert, with acknowledgement recorded.
Andon view
Shop-floor TV view of every machine's status, target, production and cycle time, colour-coded for running, idle and alarm.
Part-wise production and cycle audit
Target, produced, good and rejected quantities by machine and shift, with machining time separated from part-to-part time.
Running-part auto detection
Detects which part is running on which machine from the part master. Supports 1 to 9 pieces per cycle and single, continuous or default run modes.
Quality and SPC
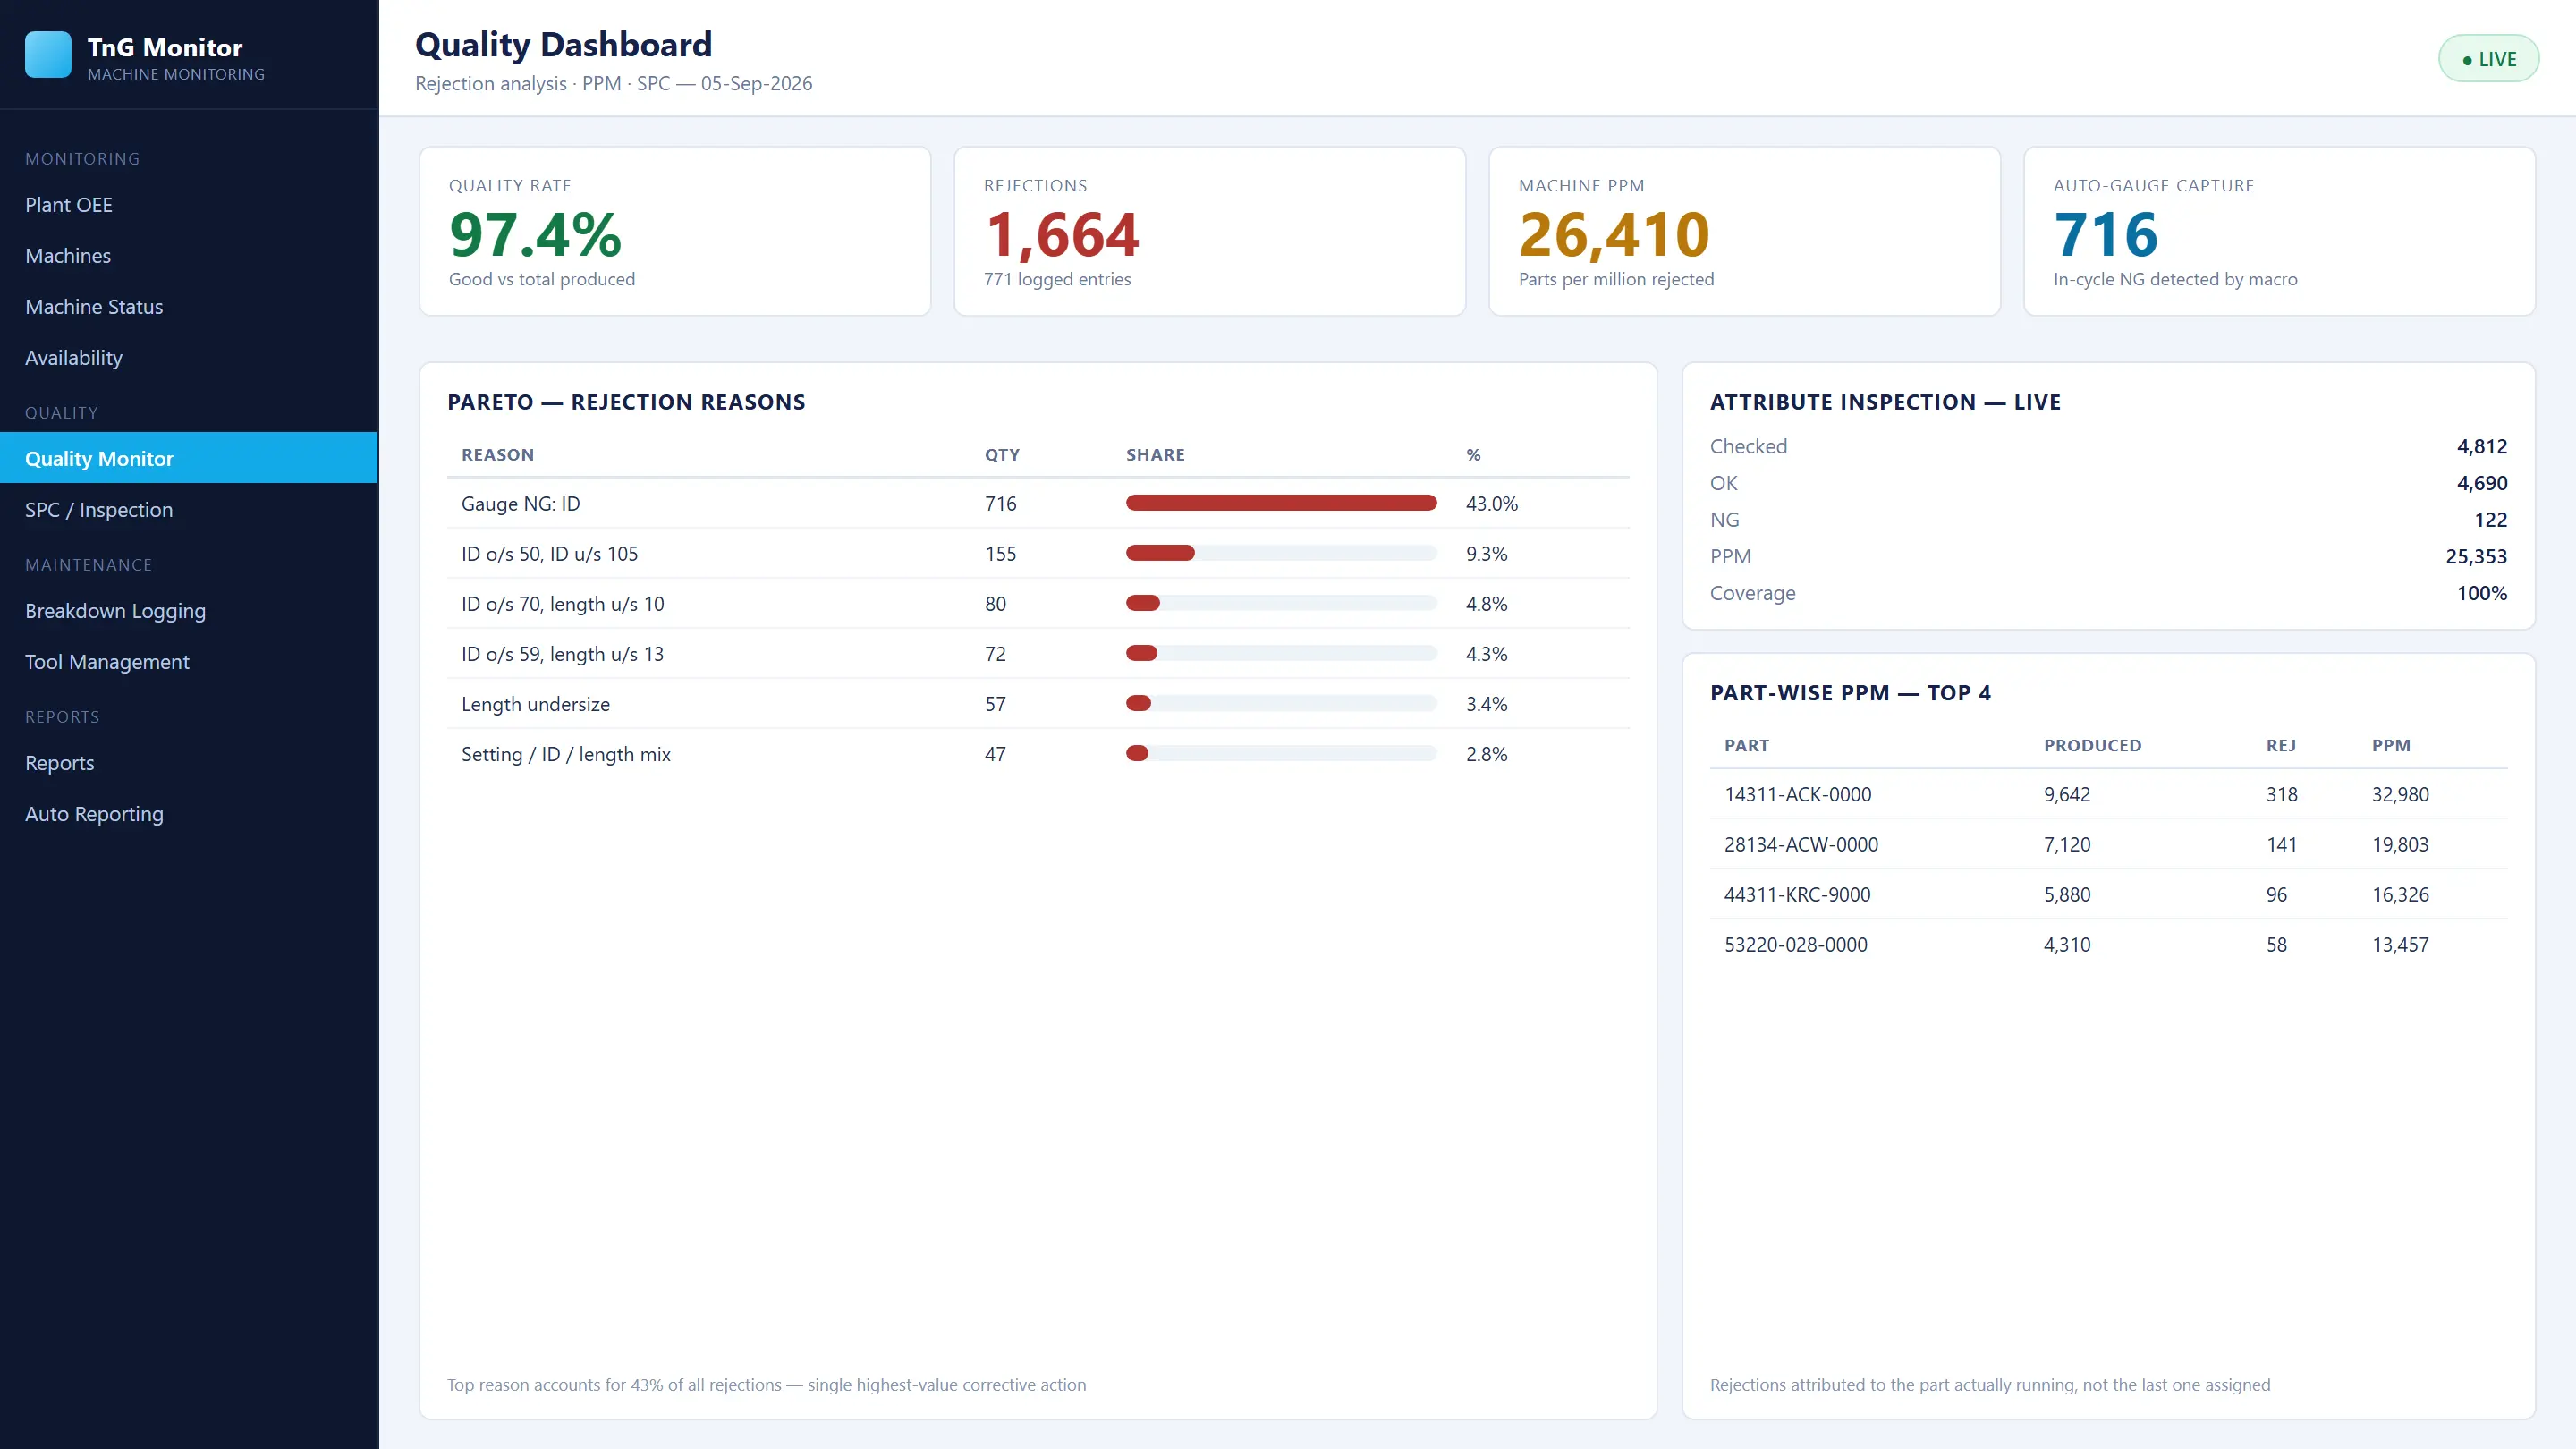
Connected gauge readings, SPC trends, Cp/Cpk and GO / NO-GO attribute checks feed straight into the quality rate of OEE.
Tool management
Tool catalogue and stock, issue and return, target versus actual tool life, insert edge history and near-life warnings.
Interrupted and power-cut cycles
Reset, alarm and power-loss events are recorded against the affected cycle, so unknown timing stays visible instead of being guessed.
Reports and mobile app
OEE, production, availability, quality, operator, cycle, breakdown and tooling reports. Export CSV or PDF, schedule Excel/PDF by email, or request them on the Android app.
See the screens
Screens show demonstration data.
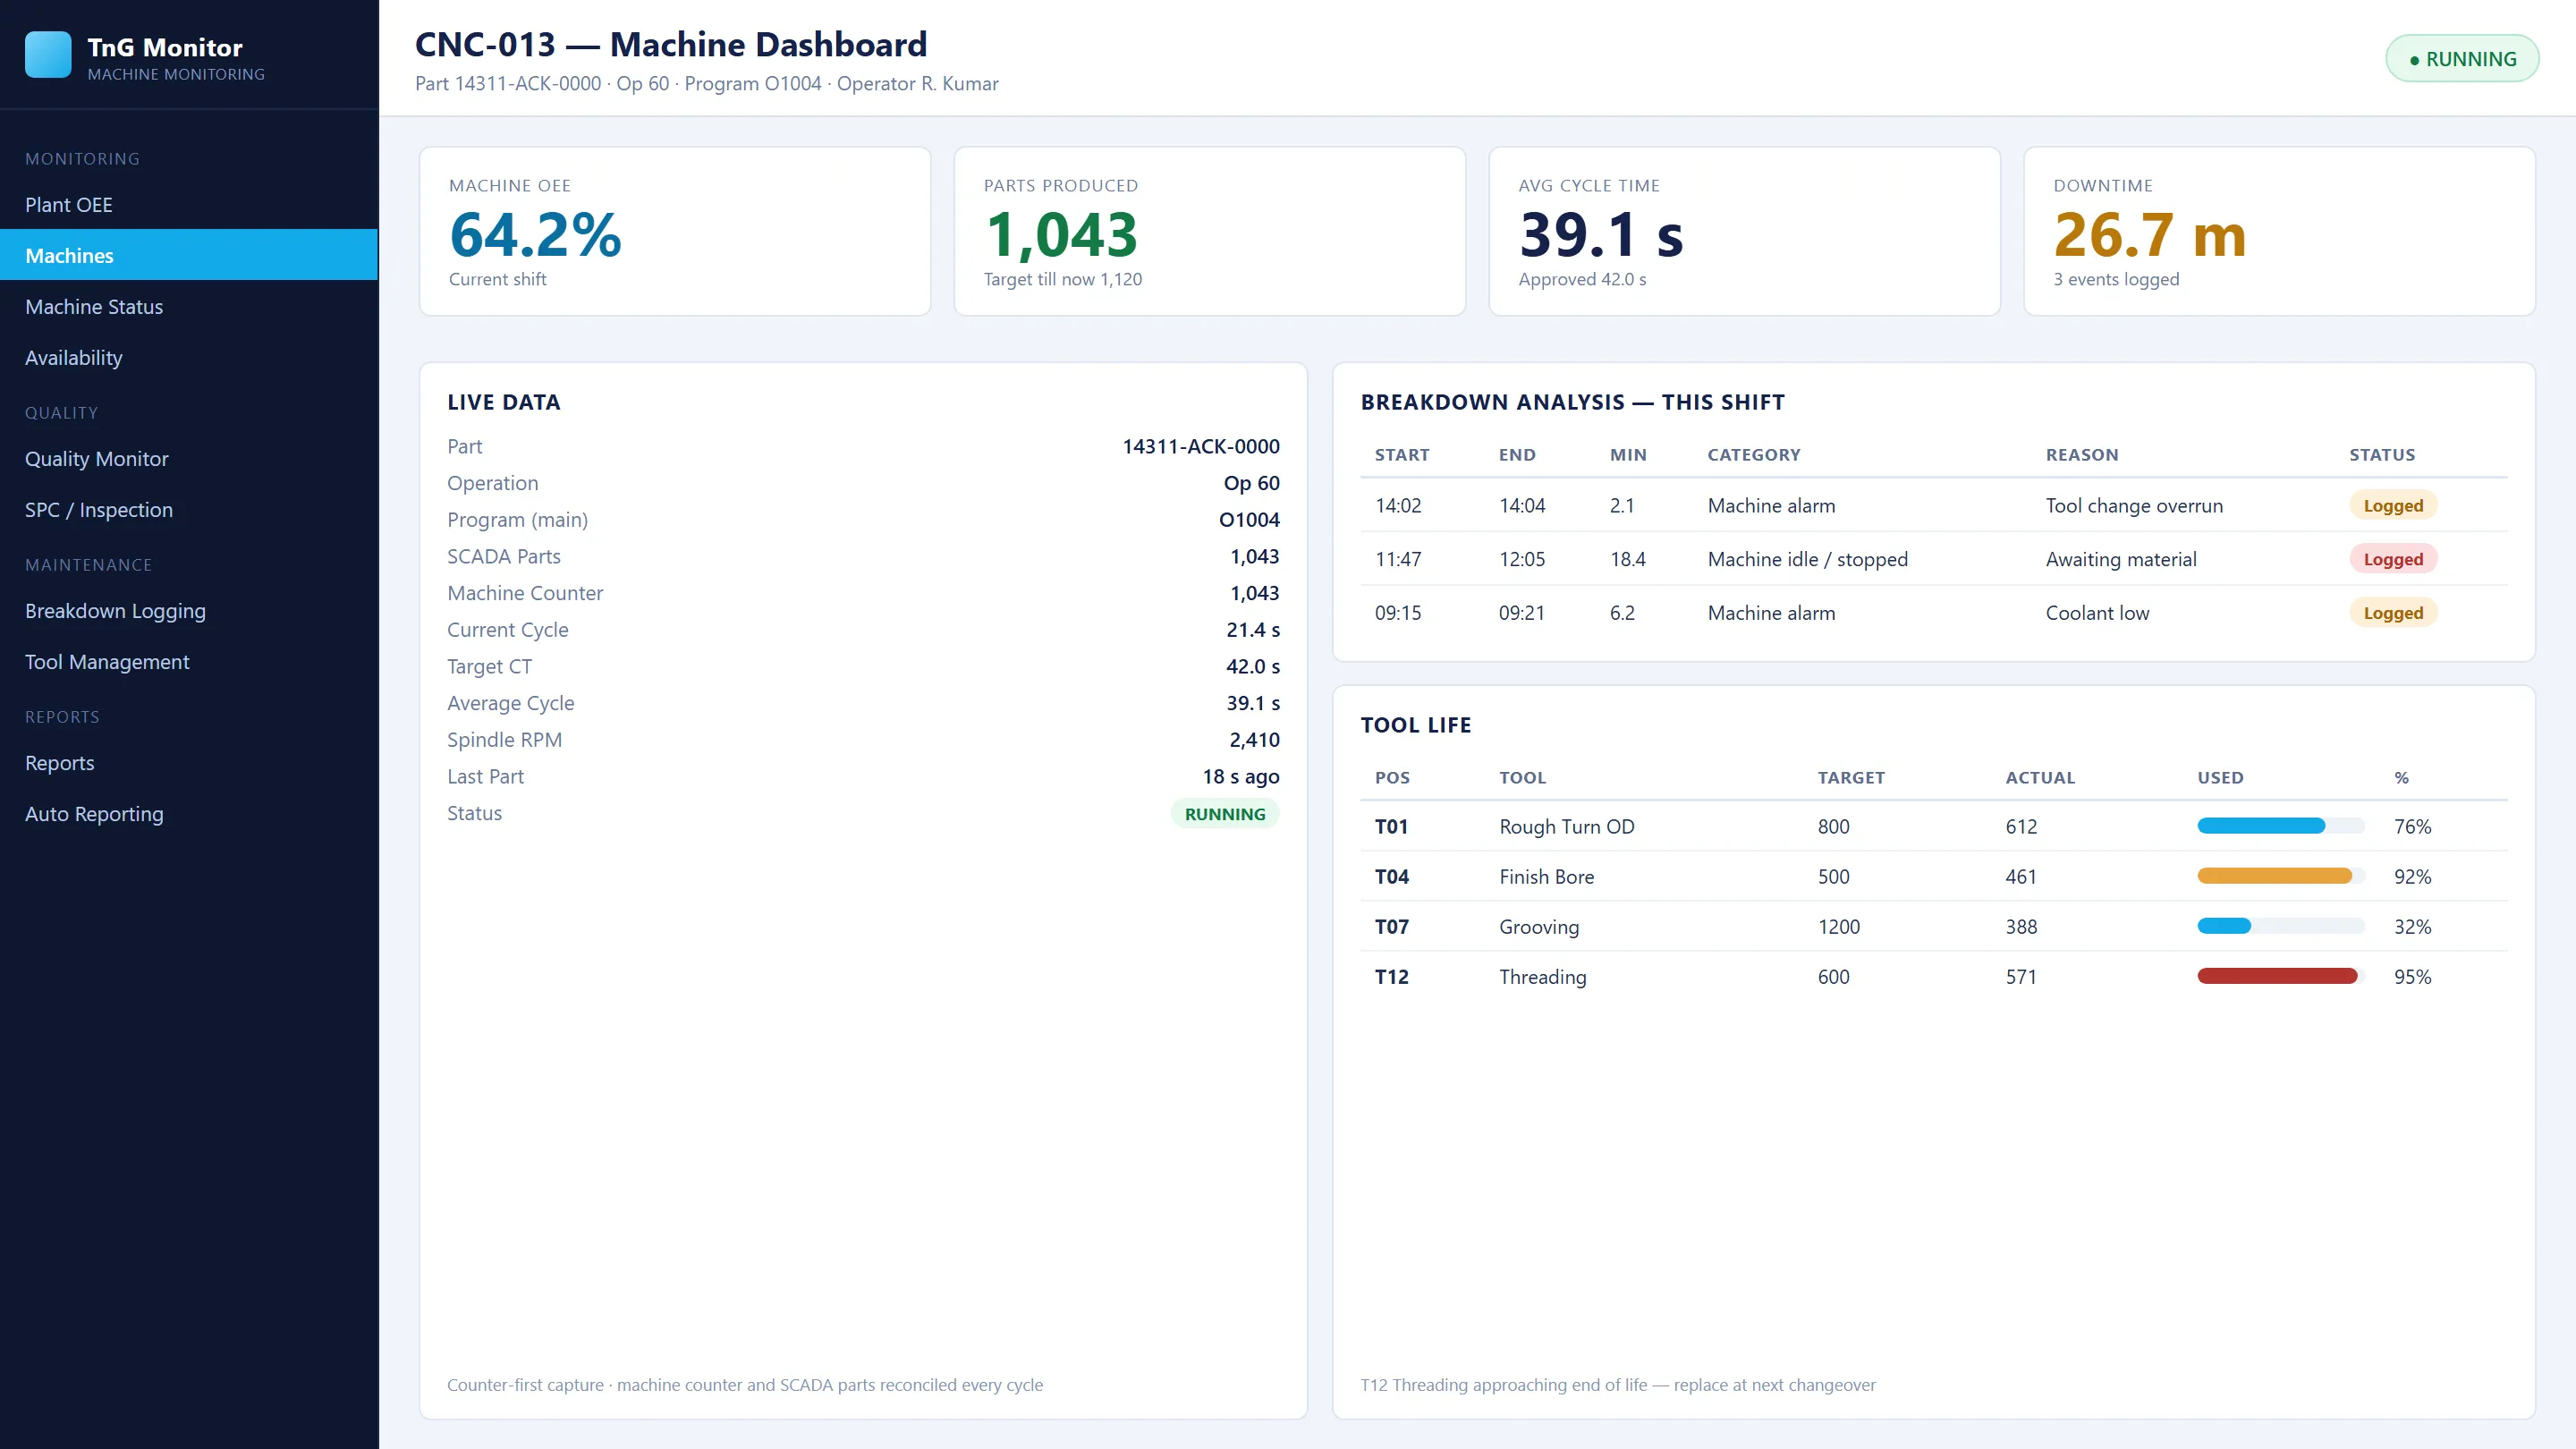
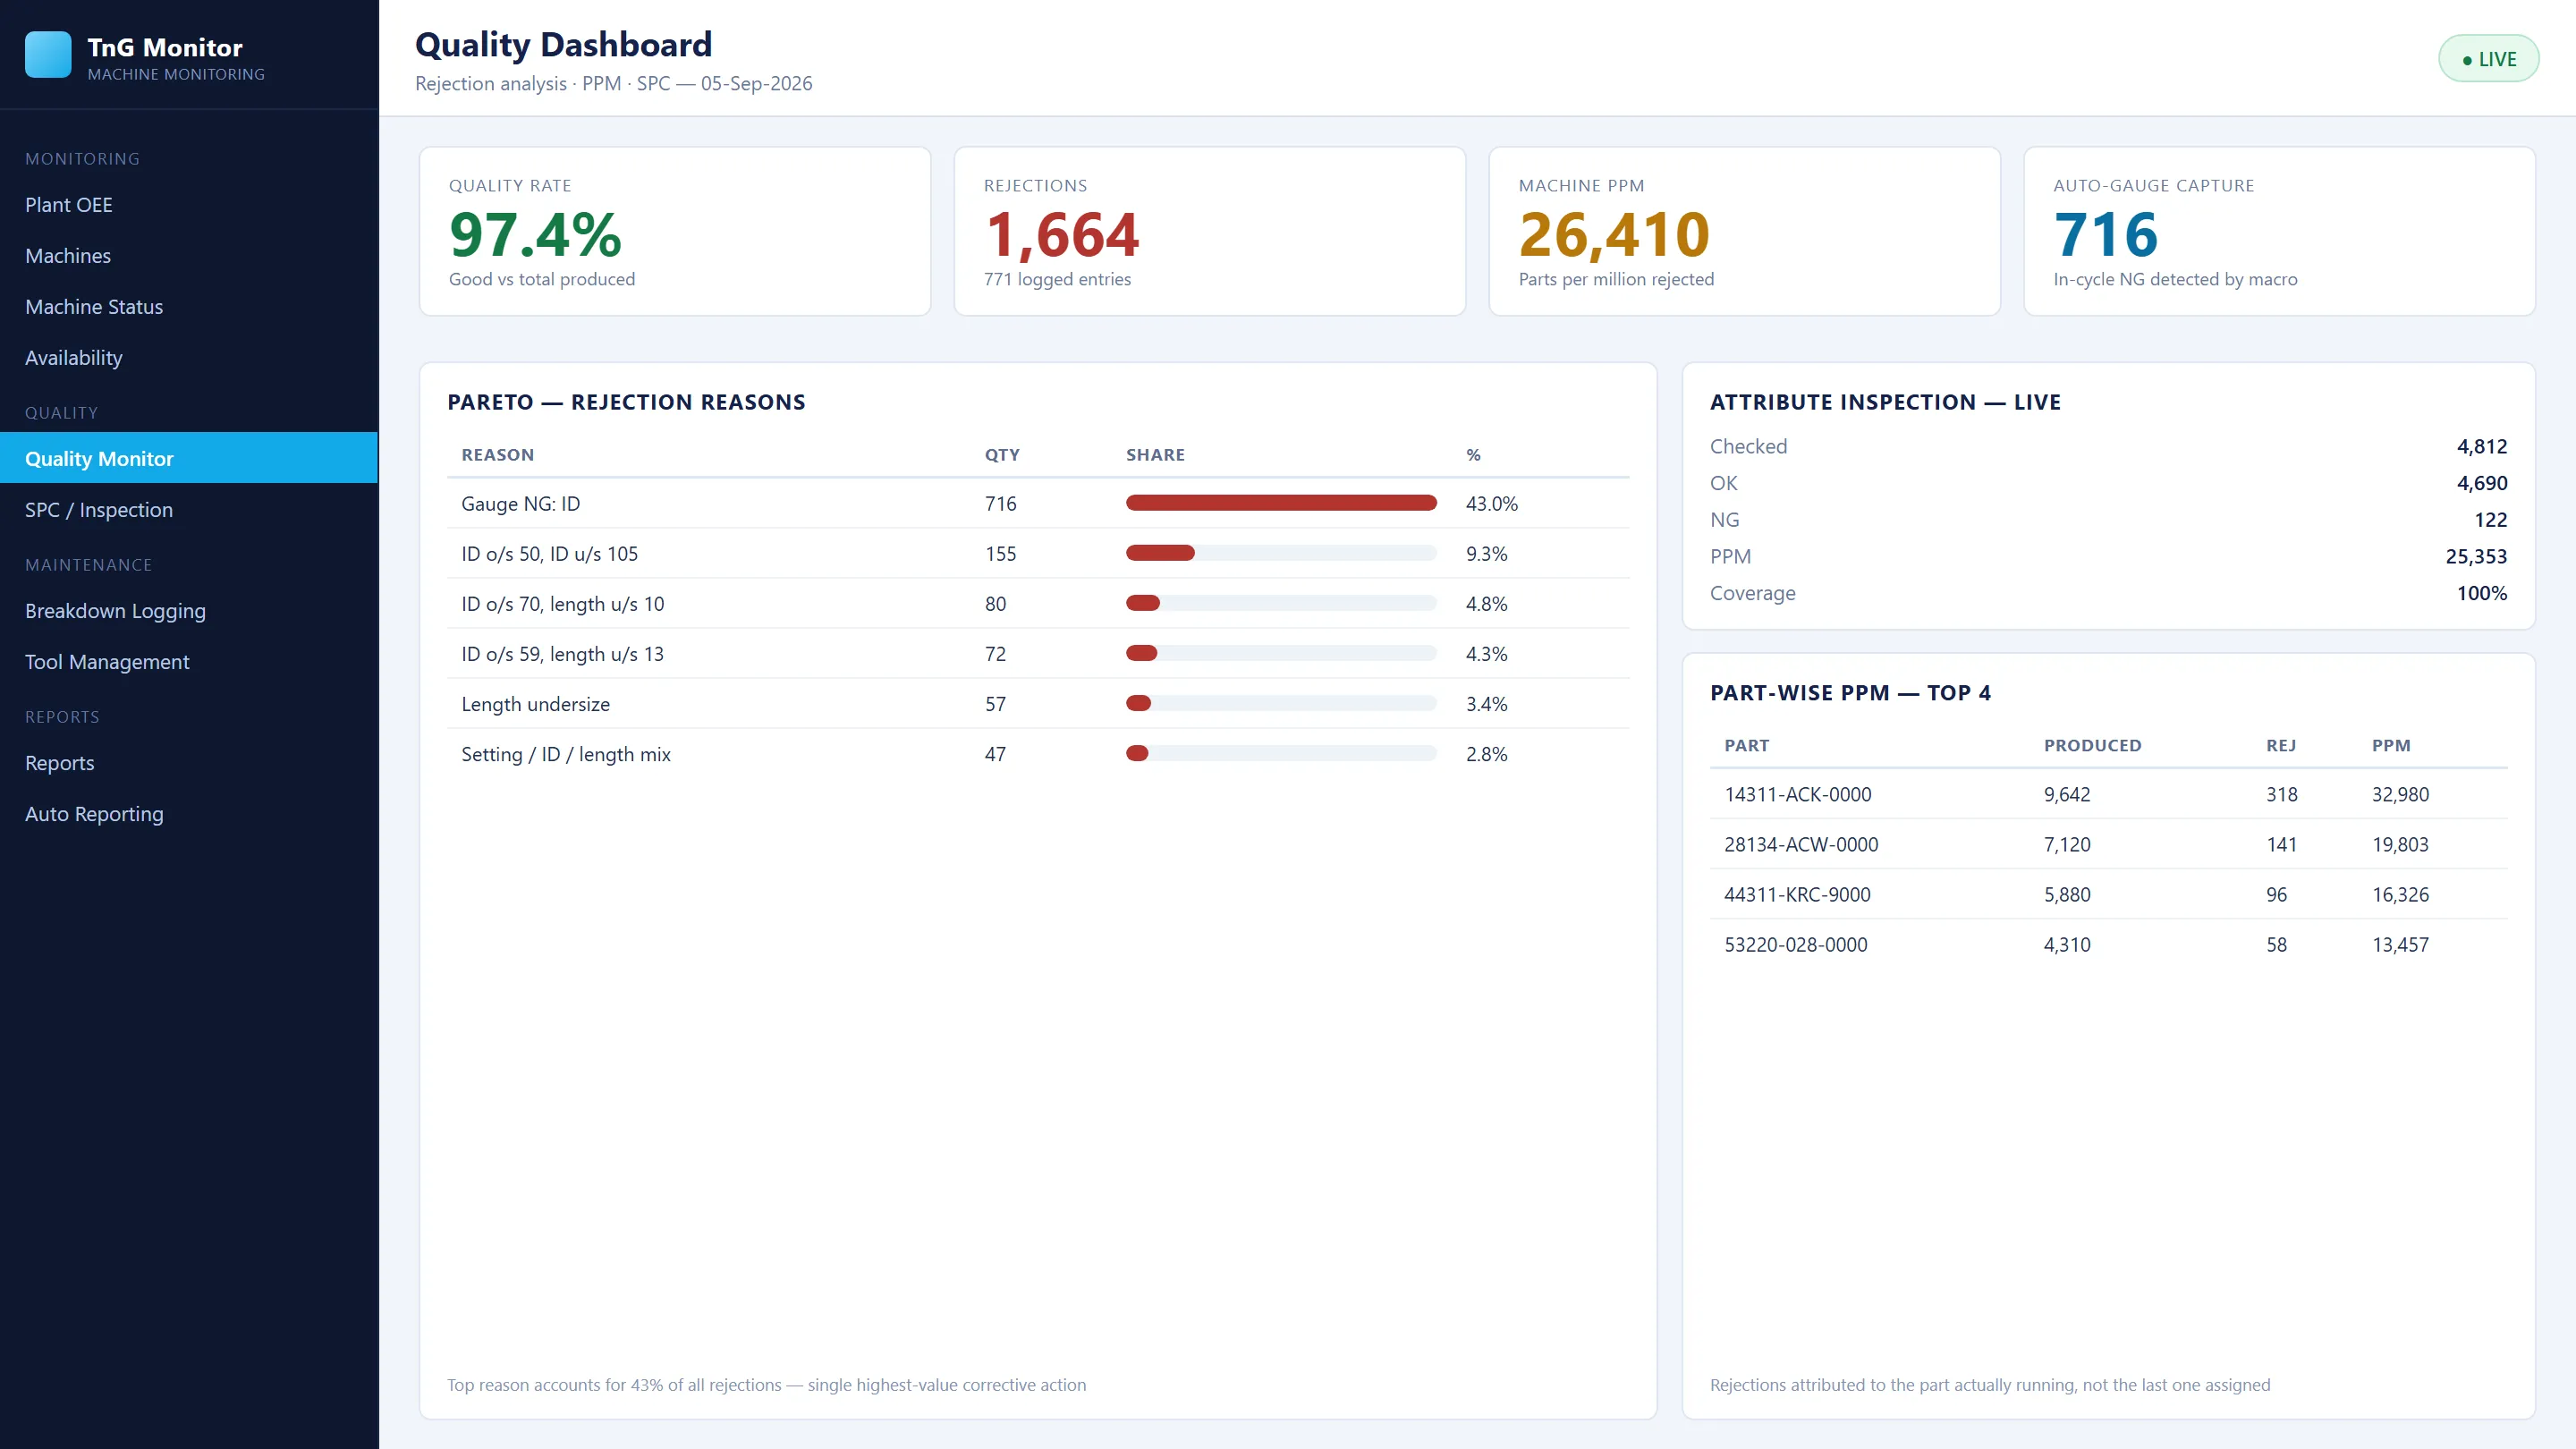
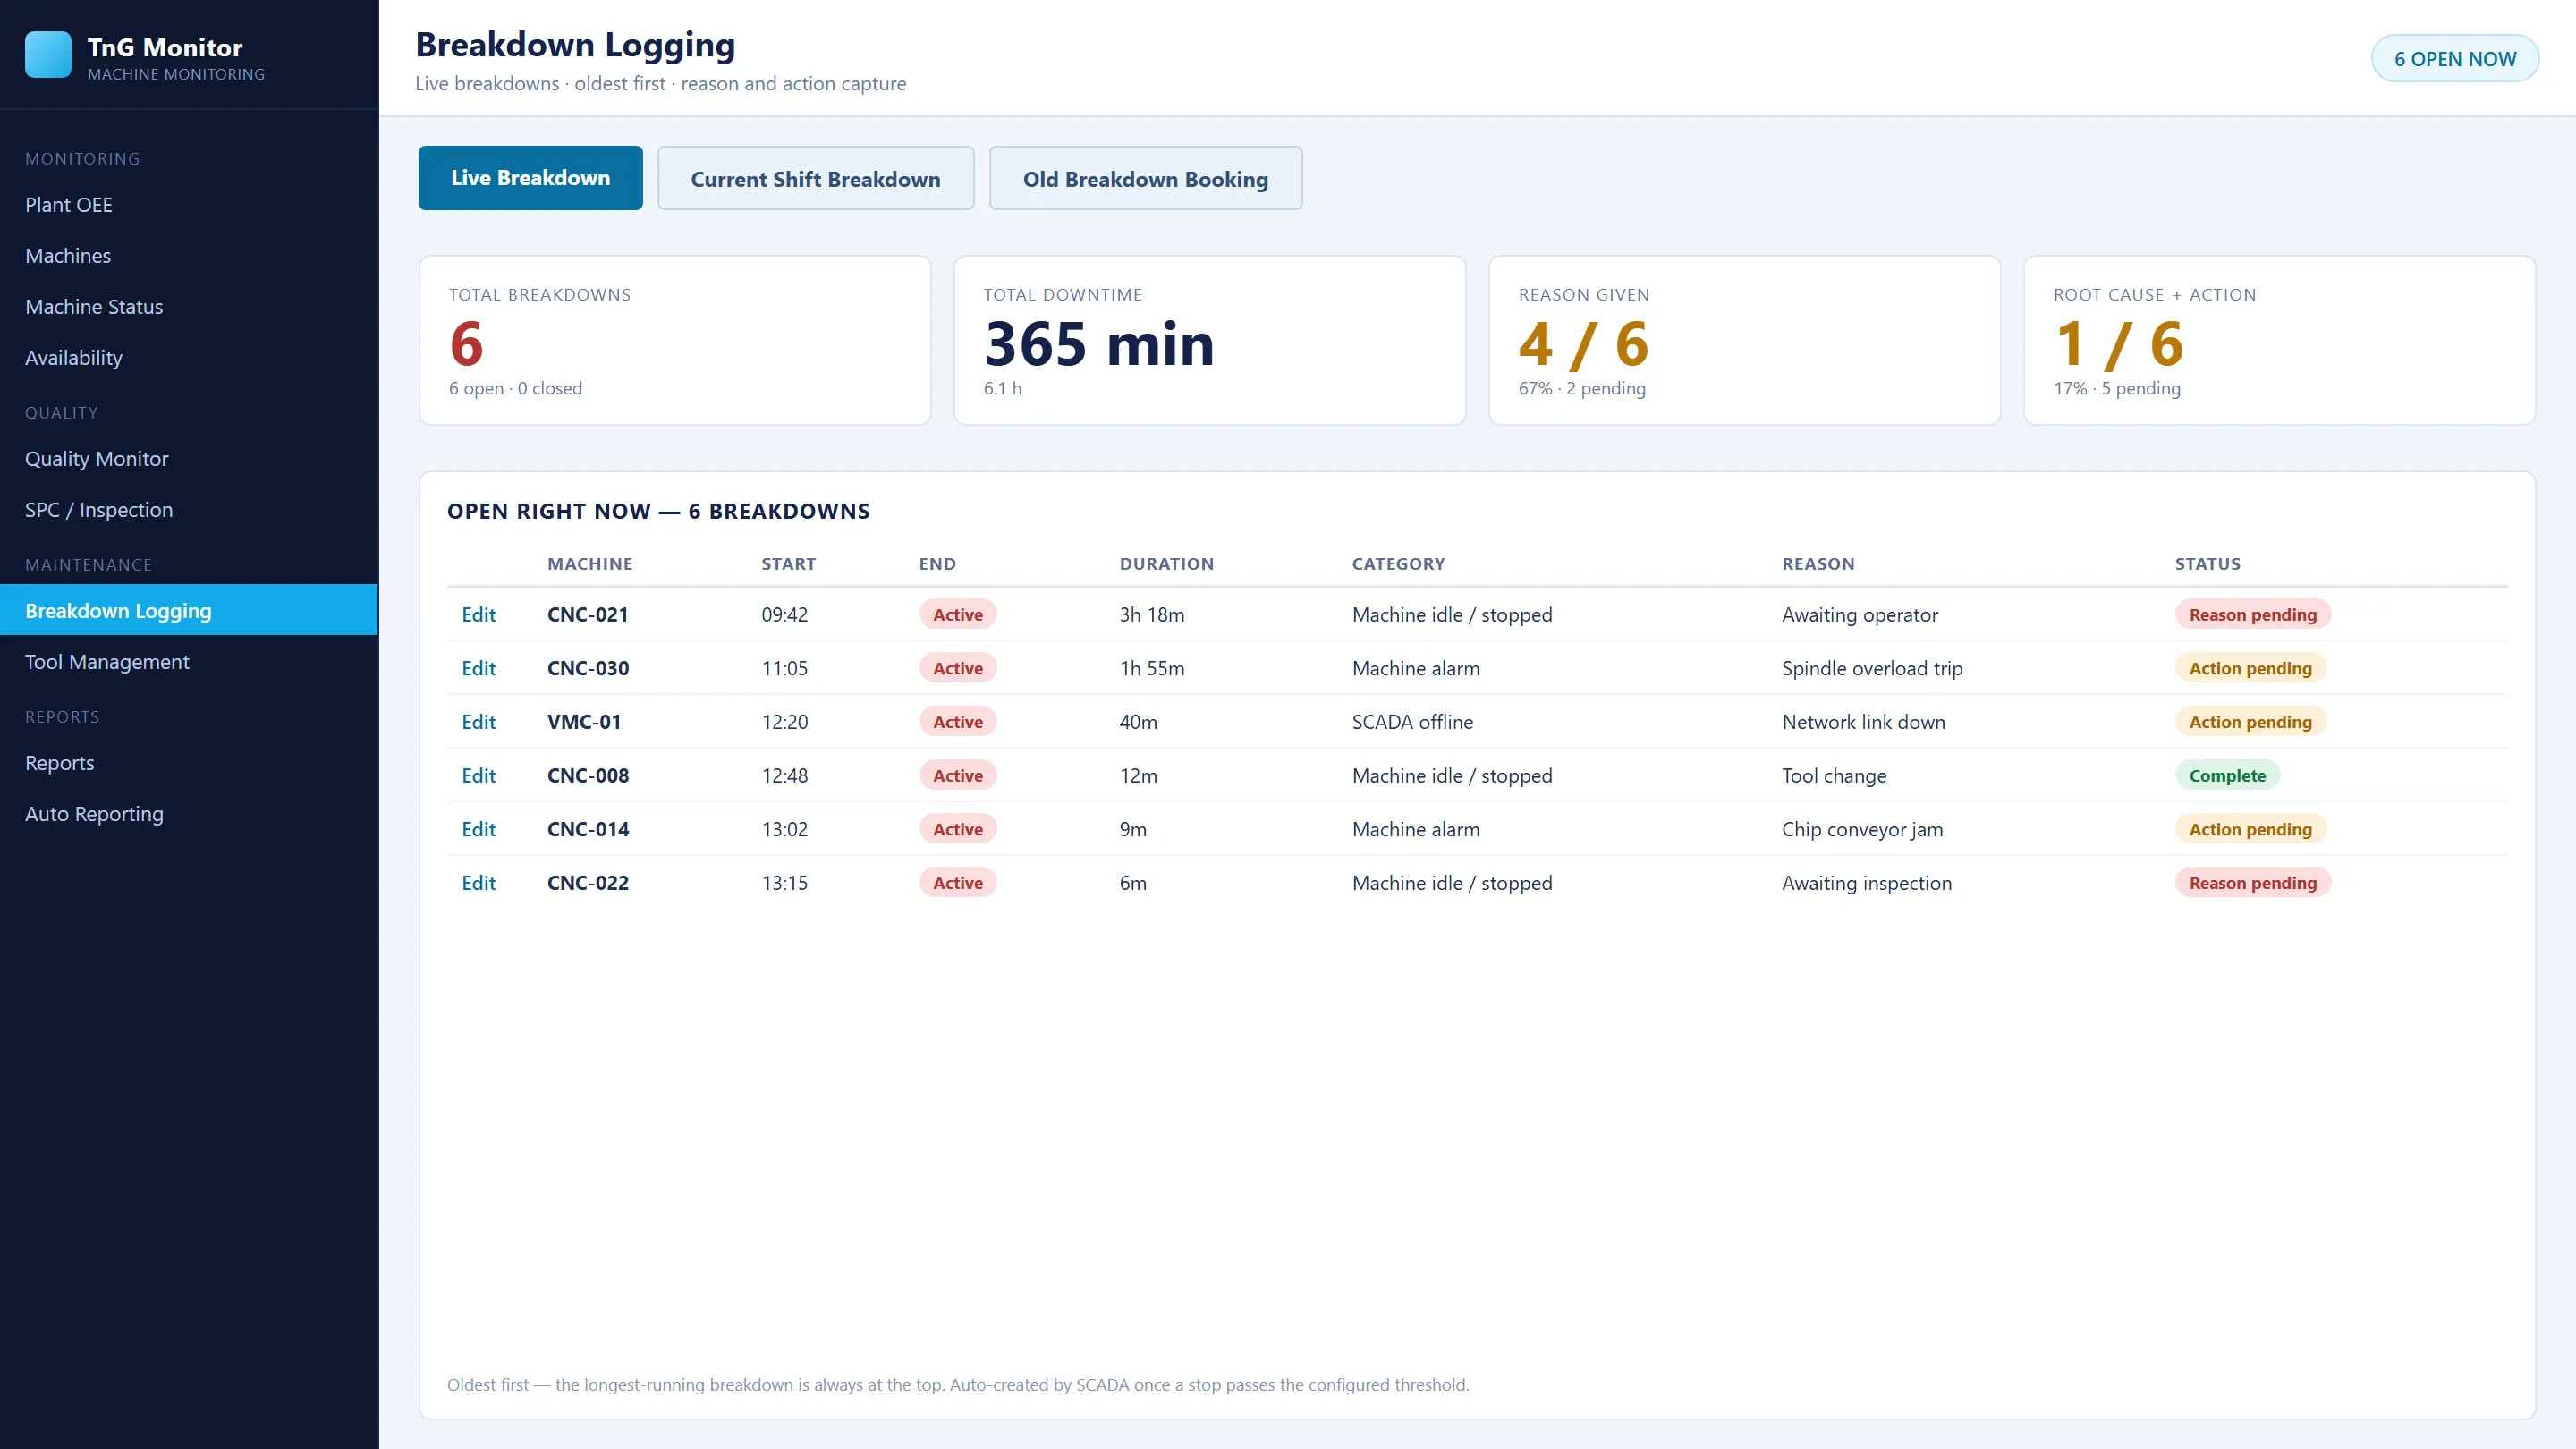
TnG Machine Monitoring System is SCADA software that connects your machines to one shared production record. It combines machine signals with part, operator and inspection information, so your team can see production progress and investigate losses during the shift, not days later.
An example from the floor
Output is behind the shift target, but the reason is unclear. The machine view shows repeated stops. The recorded reasons point to material waiting, and the responsible person was alerted at the moment of each stop. The supervisor coordinates material supply, and the team compares material-waiting time and target achievement over the next comparable shifts.
CNC controllers
- FANUC with Ethernet (0i-TD and newer)
- Legacy FANUC without Ethernet
- Siemens
- Mazak, Mitsubishi, Delta and other controls
CNC machine types
- CNC turning
- VMC
- HMC
- CNC hobbing
- CNC grinding
- CNC shaving
- CNC induction hardening
Conventional machines (after assessment)
- Cylindrical grinding
- ID grinding
- Thread rolling
- Infeed centreless grinding
- Forging press
- Milling machines
What it delivers
Department response
Live status and routed alerts help the responsible team respond to a stop.
Production accountability
Machine counter, SCADA count and cycle review make unexplained gaps visible.
Quality traceability
Inspection and rejection records connect to the responsible machine, part and shift.
Consistent reporting
Desktop, web and scheduled reports use the same stored production record.
What the solution includes
The quotation defines the included functions, services and optional items for your plant.
Machine assessment
Share your machine list and controller details for a compatibility review and pilot scope.
Plant preparation
Agree the computer or server, plant network access and any connection equipment.
System setup
Machines, shifts, part targets, user access and your reporting requirements are configured.
Training and handover
User training, operating guidance and a pilot acceptance checklist, with documented support terms.
Talk to us about Machine Monitoring (MMS)
Share your machine list and controller details. We will review compatibility and propose a pilot scope for your plant.
The Machine Monitoring (MMS) brochure is being updated. Ask for it and we will send it on email or WhatsApp.
Related products
Connected Gauging
The quality module of TnG MMS. Digital gauge readings, SPC, GO / NO-GO attribute checks, rejection alerts, red-bin interlocking and automatic CNC offset correction in one dashboard.
View Connected Gauging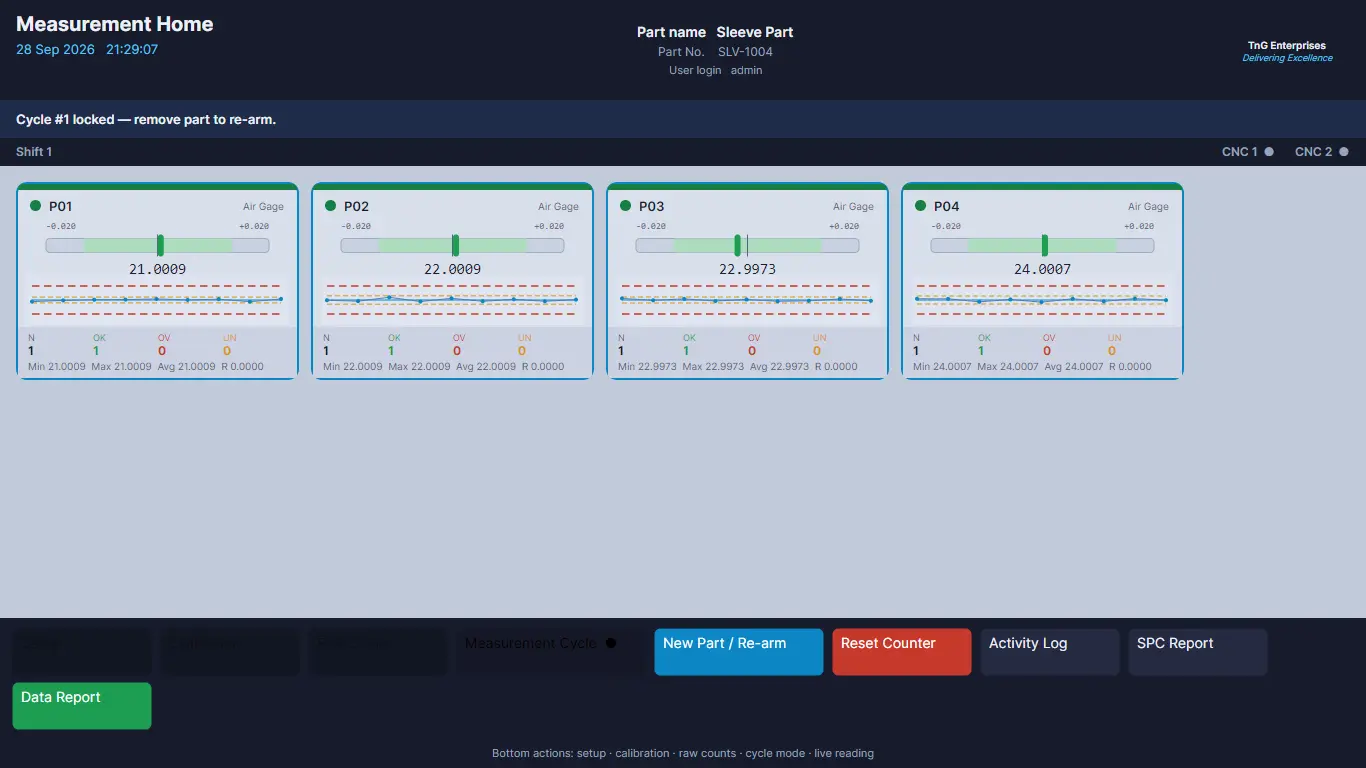
Offset Master
Closed-loop offset correction for FANUC CNC. Green / yellow / red control zones, correction direction, frequency and maximum clamp per parameter, and a full measurement and correction record.
View Offset Master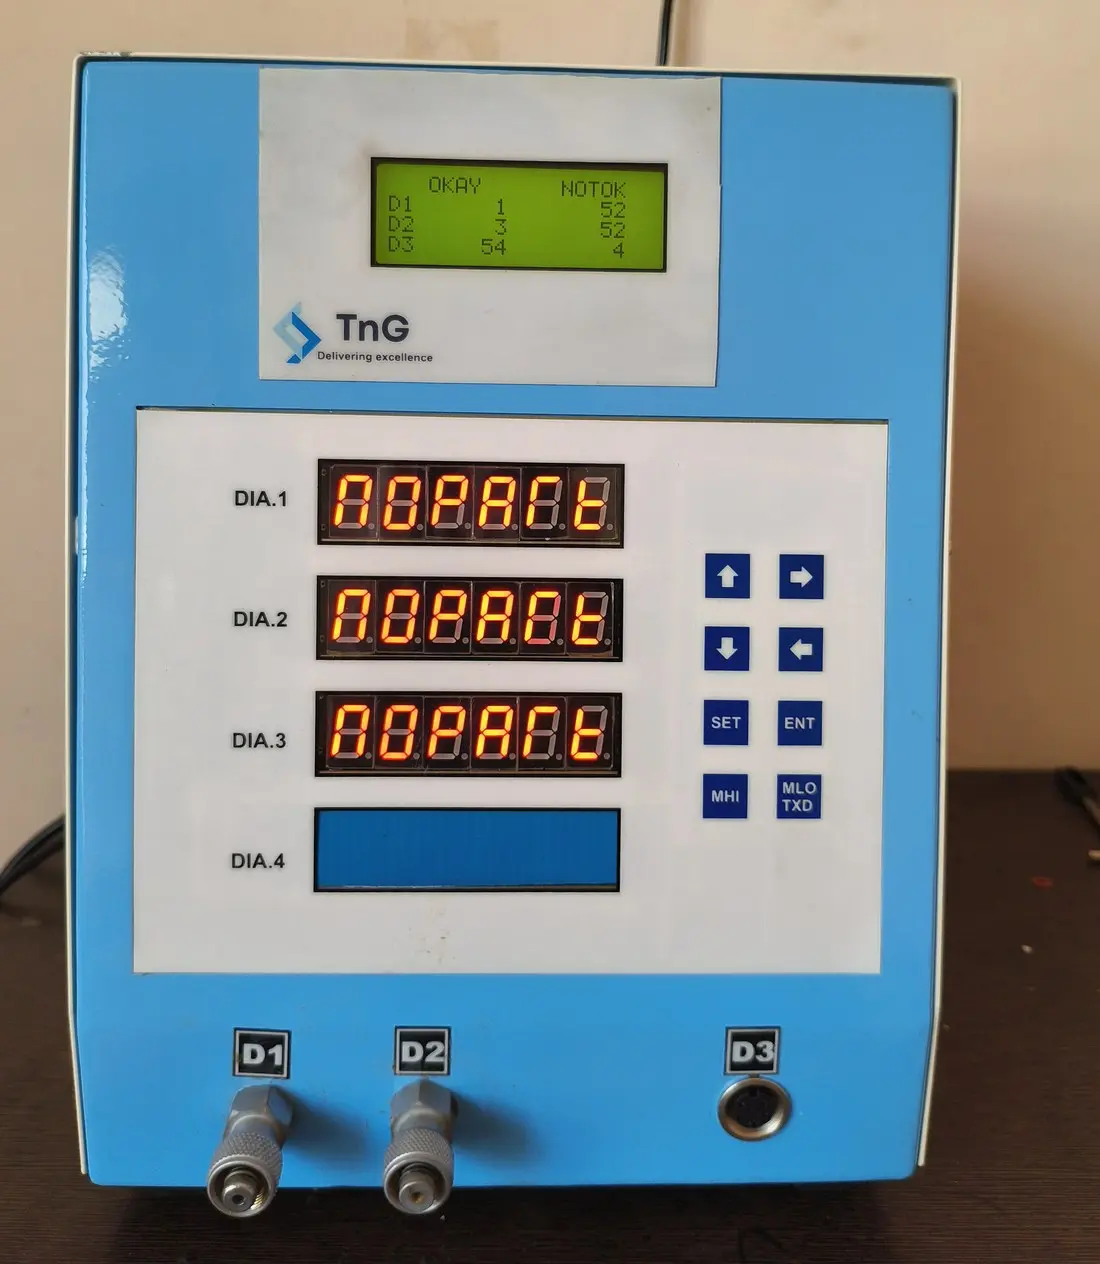
Digital Gauges
A range of TnG digital gauges for in-process inspection, from single-channel units to multi-channel piezo and probe combinations, with 7-segment LED and TFT display options.
View Digital Gauges